−Table of Contents
Tools
This submenu provides access to various image analysis plugins.
Save XY Coordinates...
Writes to a text file the XY coordinates and pixel value of all non-background pixels in the active image. For grayscale images, writes three values per line (x, y, and value), separated by spaces. For RGB images, writes five values per line (x, y, red, green and blue).
For grayscale images you can specify the background value in a dialog.
Note that the y coordinates are inverted with respect to those shown in the status bar (y=0 at the bottom) unless you select the appropriate checkbox (this unusual behavior is for compatibility with old versions).
Fractal Box Count...
This command is used to estimate the fractal dimension of a binary image. Counts the number of boxes of an increasing size needed to cover a one pixel binary object boundary.
The sequence of box sizes is defined in the Box Sizes field.
Check Black Background if the object is white [255] and the background is black [0].
The box size and the number of boxes necessary to cover the boundary are plotted on a log-log graph and the fractal dimension determined from the slope of the log-transformed data by linear regression, i.e.
D = - slope
For more information, see the “Fractal_Box_Counter.java” source file.
Analyze Line Graph
ImageJ can be used to recover numeric coordinate data from scanned line graphs using the following procedure. Steps 1-6 are not necessary for binary (black and white) graphs. For practice, use the File>Open Samples>Line Graph sample image.
- Open the image containing the graph.
- Open the thresolding tool (shift-t).
- Adjust the threshold so the graph is highlighted in red.
- Click on “Apply” (make sure foreground is black and background is white).
- Close the thresholding tool.
- Use the oval selection tool as an erasor (press backspace to erase) to isolate a single curve (note: background color must be white).
- Select the curve by clicking to the left of it with the wand tool.
- Use Edit>Clear Outside to erase everything but the curve.
- Use Analyze>Tools>Analyze Line Graph get the XY coordinates.
ROI Manager
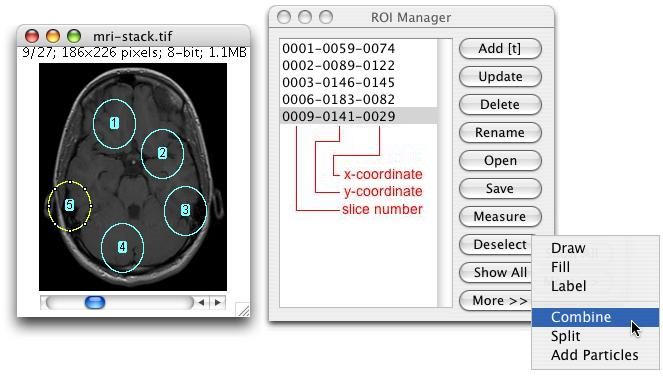
The ROI (Region of Interest) Manager is a tool for working with multiple selections. The selections can be from different locations on an image or from different slices of a stack. All selection types, including points and lines, are supported.
Click Add to add the current selection to the list, or press “t”, the keyboard shortcut for the Edit>Selection>Add to Manager command. The Roi manager creates a three part label. The first part (stacks only) is the slice number, the second part is the X coordinate of the selection, and the third part is the Y coordinate. Click on a label to restore the associated selection to the current image. With stacks, the selection is restored to the slice it came from. Click on Show All to display all the selections on the list. Hold down the shift key while clicking Add to “add and draw” and the alt key to “add and rename”.
Install the ROIManagerMacros macro set and you will be able to add a selection by pressing the “1” key, add and name by pressing “2”, add and draw by pressing “3”, and add and advance to the next slice by pressing “4”.
Update replaces the selected ROI on the list with the current selection. This is usually a modified version of a selection from the ROI Manager list.
Delete deletes the selected ROIs from the list. Deletes all the ROIs if none are selected.
Use Rename to rename the selected ROI (requires v1.35c or later).
Open opens a “.roi” file and adds it to the list or opens a ZIP archive (“.zip” file) and adds all the ROIs contained in it to the list. Use the Open All macro [insert link here] to add all the “.roi” files in a folder to the list.
Save saves the selected ROI as an “.roi” file. If none are selected, saves all the ROIs in a ZIP archive.
Measure measures all the ROIs on all the images in a stack as long as none of the ROIs are selected, and none are associated with a particular slice (all have names like “xxxx-yyyy”) or all are associated with the first slice (all have names like “0001-xxxx-yyyy”).
If this is not the case, use the More>Multi Measure function, added in ImageJ 1.38m. Multi Measure, based on a similar function in Bob Dougherty's Multi_Measure plugin, measures all the ROIs on all the images, creating a results table with either one row per image or one row per measurement.
With a stack, you will be given the option to measure all the slices if all items are associated with the first slice or all have labels in the form xxxx-yyyy. Use the Analyze/Set Measurements command to specify the measurement options.
Deselect deselects any selected items on the list. Delete, Save, Measure, Draw, Fill, Label and Combine work with all items on the list when none are selected.
Show All causes all selections on the list to be non-destructively displayed on the current image. Click again to stop displaying the selections. Click on a label (selection number) in the image to activate the corresponding selection on the ROI Manager list.
More» displays a drop down menu with six additional commands:
- Draw draws the outline of the selected ROIs using the current foreground color and line width. Draws all the ROIs if none are selected. Click in the Image>Color>Color Picker window to set the foreground color. Use Edit>Options>Line Width to set the line width.
- Fill fills the ROI using the current foreground color .Fills all selections on the list if none are selected. Click in the Image>Color>Color Picker window to change the foreground color.
- Label labels and outlines the selected items using the current foreground color. Labels and outlines all selections on the list if none are selected. Unlike Show All, this changes the image contents.
- Combine uses the union operator on the selected items to create a composite selection. Combines all the items if none are selected.
- Split separates a composite ROI into simple ones and adds them to the ROI Manager.
- Add Particles adds objects segmented by the particle analyzer to the ROI Manager. Requires that “Record Starts” be checked in the Analyze>Analyze Particles dialog box. Particle analyzer objects can also be added to the ROI Manager by checking “Add to Manager” in the Analyze Particles dialog box.
- Multi Measure, (based on a similar function in Bob Dougherty's Multi_Measure plugin) measures all the ROIs on all the images, creating a results table with either one row per image or one row per measurement.
- Sort sorts the ROIs list in alphanumeric order.
- Specify lets you specify an ROI in the same way as Edit>Selection>Specify
- Remove Slice Info command removes the information in the ROI names that associates them with particular slices.
- Help opens the ROI help page (at IJ's site) in the default browser.
- Options shows a dialog to set the color used in Show All mode and to associate ROIs with slices.
Scale Bar
Draws a labeled calibration bar of the specified Width calibrated units and Height in pixels.
[insert image dialog]
Change Font Size to adjust the labels' font size.
Change Color to adjust the text color and the Background to increase the contrast, if needed.
Change Location to move the calibration bar. If there is a selection, the bar is initially drawn at the selection.
If Bold Text is checked, labels are drawn bold.
If Hide Text is checked, only the bar is drawn.
Check Serif Font to change the font accordingly.
Calibration Bar
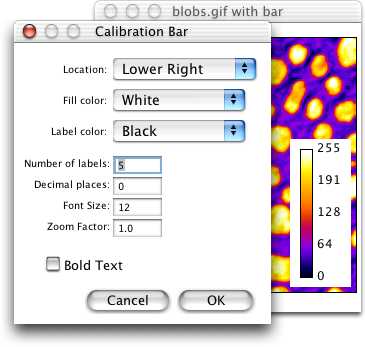
Creates an RGB copy of the current image and displays a labeled calibration bar on it.
Change Location to move the calibration bar. If there is a selection, the bar is initially drawn at the selection.
Change Fill Color to adjust the bar's background color.
Change Label Color to adjust the text color.
Change Number of Labels to adjust the total number of values displayed.
Change Decimal Places to adjust the number of decimal places present in the labels.
Change Font Size to adjust the labels' font size.
Change Zoom Factor to scale the entire calibration bar.
If Bold Text is checked, labels are drawn bold.


