−Table of Contents
Analyze_Stripes
Analyze_Stripes is a Fiji (or ImageJ) macro designed to automatically measure the width, edge roughness, and orientation angle of stripes.
Introduction
The Analyze_Stripes macro was developed for scanning electron microscopy (SEM) metrology of electron beam lithography written stripes. However, the macro is useful to anyone who needs to analyze stripe widths, edge roughness, and orientation angle. The result is an average of nearly all of the edge pixels within the region of interest (ROI) and generally yields precision beyond the pixel resolution.
This macro was built upon my previous Matlab™ script, though I made significant changes when I ported it to Fiji. [Justin R. Bickford, “Automatic Stripe Analysis Tool”, Army Research Laboratory Tech Report #6469 (2013).]
Features
- Automatically (with optional user assistance) analyze the width and edge roughness of stripes after user ROI selection.
- Stripes of any sense (light on dark, dark on dark, etc.) and any direction can be analyzed.
- Generates report file in tab-delimited format for inclusion in spread sheet programs.
Installation
Download the latest version of Analyze_Stripes.ijm here to the Fiji.app/plugins/ (or ImageJ/plugins/) directory (or subfolder) and run Help>Refresh Menus or re-open Fiji (or ImageJ) to see Analyze_Stripes in the Plugins menu (or submenu). Remove the ‘.txt’ extension if your browser happens to append one.
If you'd like to analyze the stripe edge data yourself, use this version.
You may define a shortcut yourself via Plugins>Shortcuts>Create Shortcut or you can install the macro and it will default to the F1-key shortcut. I like using Fiji, although this macro will certainly work in ImageJ1. Fiji website: http://fiji.sc/Fiji
Application Description
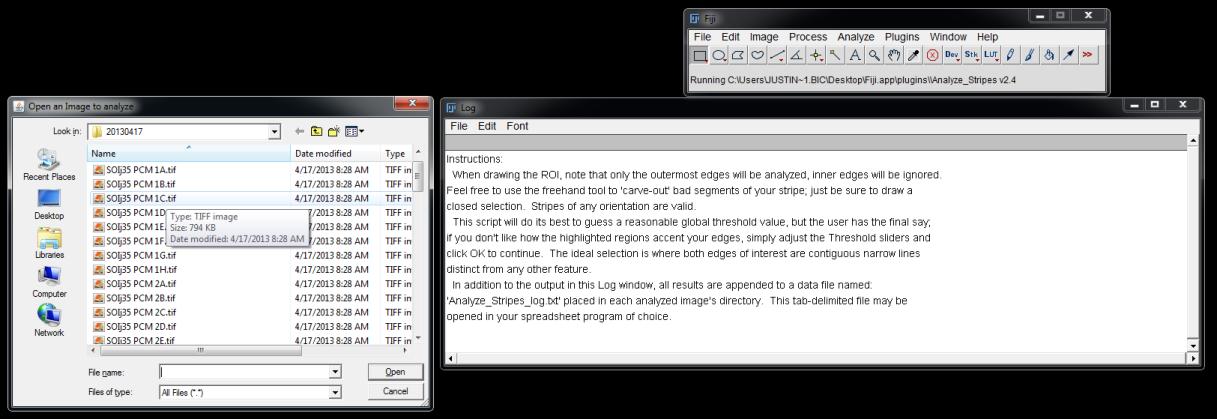
Any single input image that Fiji (or ImageJ) can accept is allowed, the result is converted into a 16-bit grayscale image during analysis. The original image is not altered in any way. The user is prompted to open an image and given an overview of what the macro does in the Log window.
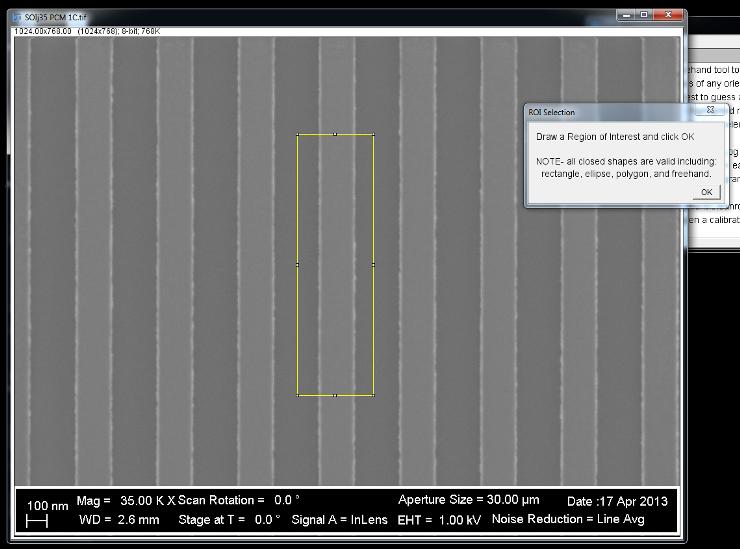
Select an ROI that encompasses the farthest stripe edges you want to measure.
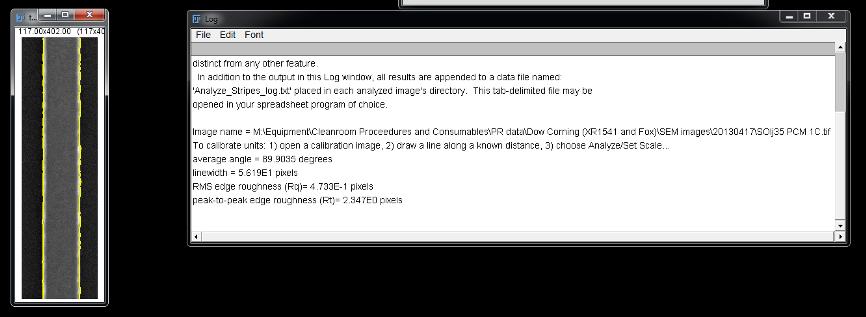
The macro automatically finds the edges and the user is prompted to refine the threshold as desired. An ideal threshold would be where the edges of interest are solid but narrow lines.
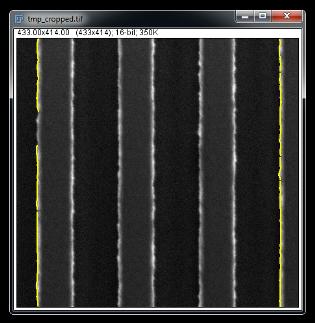
The macro then chooses the farthest edges (highlighting the edges in yellow) and analyzes them, sending the results to the Log window. It appends a tab-delimited log file with the results, as well.
- - - - - - - - - - - - - - - - - - - - - - - - - - - - - - - - - - - - - - - - - - - - - - - - -
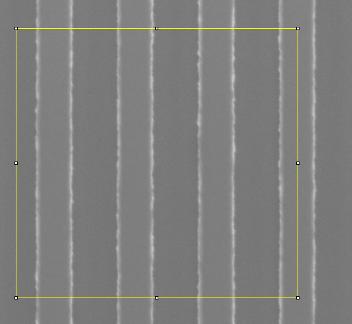
You can also select multiple stripes – the farthest edges in the ROI are the ones that are analyzed.
*Note that in this case I have shown how you can choose left edges to extract period spacing, rather than stripe width (as above).
- - - - - - - - - - - - - - - - - - - - - - - - - - - - - - - - - - - - - - - - - - - - - - - - -
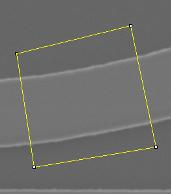
The polygon selection tool can be used to draw ROIs around angled lines that are not horizontal or vertical.
*Note that the linewidth output value is the average perpendicular distance between the lines using the average orientation angle. The macro actually does this all the time even for nearly vertical or nearly horizontal lines, correcting even minor orientations that may exist.
- - - - - - - - - - - - - - - - - - - - - - - - - - - - - - - - - - - - - - - - - - - - - - - - -
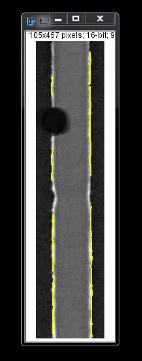
The polygon selection tool can also be used to draw ROIs around unwanted particles or defects in the image. I couldn’t find a good example of a test image with a particle, so I “burned” a mark into this image.
Output
The image filename, stripe width, edge roughness, and orientation angle are output to the Log window as well as to a tab-delimited file for easy inclusion into spreadsheet programs. This tab-delimited file is saved in the same directory as every analyzed image. Data are appended to the log if the file already exists. Feel free to delete or rename the file when you want to start a new log session or modify its content using the text editor of your choice.
Tips
There is no need to close old analyzed images before analyzing new ones, just let the analyzed image windows pile up as you desire for post-process browsing.
Although the macro will work without it, I suggest you set the pixel scale by:
- loading a scale calibration image,
- drawing a line across a known length [feel free to zoom-in and adjust the endpoints], and
- choosing Analyze>Set Scale.
By choosing Global, the scale will be used for all subsequent images (within one instance of Fiji). If you know the pixel scale, you may also input it directly without having to draw a calibration line.
Known Bugs
- The macro is most robust on images that have sharp edges; too noisy and reliability may suffer.
- If the image is too noisy:
- After the image has been selected and displayed, but before selecting an ROI and cropping; smooth it one or more times via Process>Smooth (or Ctrl+Shift+S).
- This will keep the object edges in place and improve the automatic line edge finding portion of the macro. However, overdoing it will artificially lower your line edge roughness values.
- The macro occasionally ‘forgets’ to display the original image (due to an issue with ImageJ), displaying a gradient instead. To correct the issue when it happens just hit Ctrl+R or File>Revert.
Developer:
Justin R. Bickford
Contact Information
For inquiries regarding feature requests, bug reports, or anything else related to the Analyze_Stripes macro, please email me at: justin.r.bickford.civ@army.mil
License Information
Copyright 2013 Justin R. Bickford.
Permission is hereby granted, free of charge, to any person obtaining a copy of this software and associated documentation files (the “Software”), copy, modify, merge, publish, or otherwise alter this software for educational or academic purposes subject to the following conditions:
The above copyright notice and this permission notice shall be included in all copies or substantial portions of the Software.
The copyright holders of other software modified and included in the Software retain their rights and the licenses on that software should not be removed.
Cite the author (above) of this macro in any publication that relies on the Software. Also cite those projects on which the Software relies when applicable.
THE SOFTWARE IS PROVIDED “AS IS”, WITHOUT WARRANTY OF ANY KIND, EXPRESS OR IMPLIED, INCLUDING BUT NOT LIMITED TO THE WARRANTIES OF MERCHANTABILITY, FITNESS FOR A PARTICULAR PURPOSE AND NONINFRINGEMENT. IN NO EVENT SHALL THE AUTHORS OR COPYRIGHT HOLDERS BE LIABLE FOR ANY CLAIM, DAMAGES OR OTHER LIABILITY, WHETHER IN AN ACTION OF CONTRACT, TORT OR OTHERWISE, ARISING FROM, OUT OF OR IN CONNECTION WITH THE SOFTWARE OR THE USE OR OTHER DEALINGS IN THE SOFTWARE.

