Table of Contents
Mitochondrial Morphology
Mito-Morphology Macro
Introduction
This macro allows you to measure mitochondrial interconnectivity and elongation from epifluorescence micrographs of cells immunostained for mitochondria or transiently expressing mitochondrially targeted GFP. This macro was designed by Ruben K. Dagda at the University of Pittsburgh (2010). This macro only works on the old version of Image J, and for versions 1.44 and 1.46.
This macro is currently maintained and supported by grants NIH/NINDS R01NS105783-01 grant and by NIH/NIGMS R25 1R25-OD023795-01
Authors
Some of the code originally inspired by Stefan Strack, Ph.D., University of Iowa
and modified and amplified by
Main author: Ruben K. Dagda, Ph.D., University of Nevada School of Medicine
Contributors: Charleen Chu, University of Pittsburgh, intellectually contributed to previous macro editions and finding alternate mathematical ways (area/perimeter divided by the minor axis of mitochondria) for quantifying abnormally swollen mitochondria.
Features
Allows you to threshold mitochondria in the cell to be analyze. Macro gives you measurements of mitochondrial count, total mito area, total area perimeter, area/perimeter divided by circularity and by minor axis, average circularity and average Area/Perimeter Ratios.
NOTE: This macro only works for RGB images. If black and white images are desired, then just delete the run(“RGB Split”); code lines in the macro, save it as a different version and re-run it.
**Description**
This is a macro consisting of three macros. These sub-macros are defined as the following:
a) Activate Macro by pressing “F9” key. Select cell to be analyzed with the polygon tool b) Press “F10” key to process the image, you can threshold the mitochondria at this stage. c) Press “F11” to measure the mitochondria
The macro asks the user whether he/she wants to measure mitochondria from another cell in the same field, if yes, you can select another cell with the polygon tool and follow steps b-c above. The following images were captured by Monica Rice (Center for Molecular Medicine, University of Nevada School of Medicine).
Prior to analyzing for mitochondrial morphology, it is highly imperative to set the scale on Image J to (pixels per 1 um) by using the “set scale” function and clicking the “global” function to accept the scale for all the images analyzed. Please read the following specific instructions on how to analyze mitochondria on a single cell:
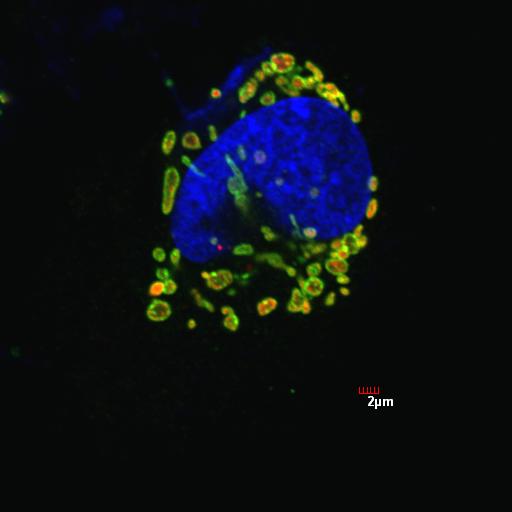
1. Select the area of interest (one cell) to analyze using the polygon selection tool. Make sure to draw the cell and enclose it with boundaries as accurate as possible. The following example is a neuroblastoma cell (left panel) treated with 6-hydroxydopamine, a strong inducer of mitochondrial fragmentation, and immunostained for mitochondria.
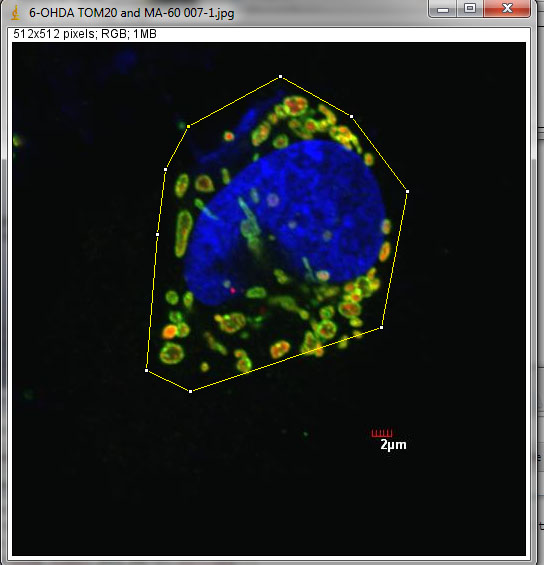
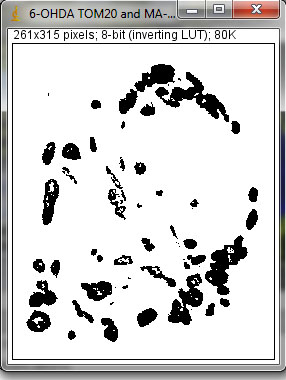
2. Next, press function 10 [F10] to process the image. The macro will automatically split the channels into blue, green and red sequentially and close the blue and green channels. If you need to analyze the green channel, the code of the macro has to be slightly modified by deleting one “close” line code on the text file of the macro and re-saving it with a different file name (ie., Mito morphology macro_green channel). The red channel will be exposed based on the previous selection and the image will be automatically thresholded. The user is then responsible for optimizing the thresholding of mitochondria with red pixels by scrolling the selection bars. This is the only qualitative aspect of the image processing step (hence, the name semi-quantitative image-based quantification). Alternatively, the user may choose the “Reno/Enthropy” function of the threshold window by clicking “Reno Enthropy”, then pressing accept.
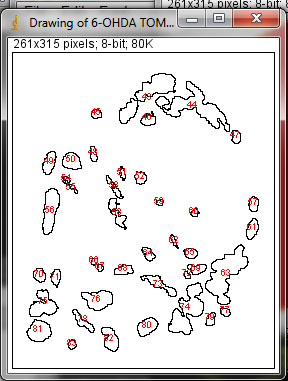
3. Next, press function 11 [F11] to analyze the different mitochondrial parameters as shown on the figure panel on the right.The macro will draw individual outlines for each mitochondrion and calculate the average circularity, average perimeter, average area, average area/perimeter ratio, average area/perimeter ratios normalized to the minor axis of mitochondria or circularity in order to account for swollen mitochondria that attain a large area and may be confounded with interconnected mitochondria as defined by a high area/perimeter ratio as well.
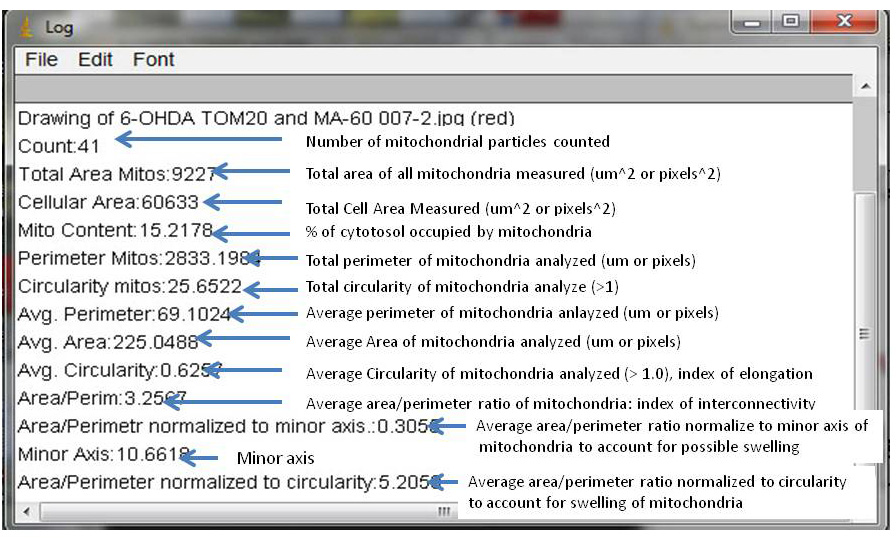
4.The results for the aforementioned morphological parameters are further explained in detail in the figure panel shown below the “threshold” and “mitochondrial outline” panels. In brief, the average circularity is a measure of mitochondrial elongation. This parameter is sensitive for fragmented to normal shaped mitochondria. The average area/perimeter ratio is sensitive for normal to highly interconnected mitochondria that are visualized as a single interconnected reticular network. The average area/perimeter ratio normalized to the minor axis (assuming that mitochondria are considered as ellipses) accounts for conditions that can induce mitochondrial swelling. The figure panel on the right bottom shows the “Log” window after the analyses is finished. Each abbreviated output (parameter and value) has been further described with arrows and descriptive tags as shown in the right figure panel. It is imperative to use controls for every mitochondrial morphology experiment including overexpressing dynamin related protein 1 (Drp1) to fragment mitochondria or mitofusin 1/2 or dominant negative Drp1 to fuse mitochondria. Alternatively, non-neuronal cells can be exposed with the strong mitochondrial fission inducer staurosporine for 2 hours, a step that precedes BAX translocation to mitochondria and apoptosis. Finally, press function 4 [F4] to close all unwanted windows prior to analyzing the next image.
Disclaimer: The area/perimeter and inverse circularity ratios were validated using Drp1 controls in genetically modified cells, but further experience indicates important limitations to their use under pathological situations involving massive swelling of fragmented mitochondria.
However, if the observer notices that predominantly swollen mitochondria are observed in an image set, then it is advised to factor in the minor elliptical axis to account for swollen mitochondria (“Mito Morph accounted by minor axis”(Area/Perimeter)/minor axis). For further questions, contact Ruben Dagda at: rdagda@medicine.nevada.edu 
Installation
Copy “Mito Morphology” code into a Notepad file for PC and transfer file to the Macro folder of Image J or download from here:mitophagy_ver_1_44_final_colocalization_f.txt
Please Note: This is a multi-functional macro to analyze for colocalization of GFP-LC3 with mitochondria, mitochondrial area in cells, mitochondrial morphology and colocalization of puncta or structures with mitochondria.
Press F9 to start macro and open image
Press F10 to process selected image
Press F11 to measure mitochondrial content, morphology (area/perimeter, circularity, area/perimeter divided by circularity, area/perimeter divided by minor axis of an ellipse)
Press F12 to measure the number of colocalized structures
Press F4 to close all unwanted windows (recommended to clear out the system memory when doing colocalization analysis, make sure to do this for every region of interest analyzed.
Download
Download macro text file above and copy and paste these files onto the Plug-In folder of Image J. Copy the text of the Mito Morphology Macro as a text file (Word) and save it onto the Macros folder. Please download at this link below and save it to the “Macro” folder of Image J. mitophagy_ver_1_44_final_colocalization_f.txt
License
The authors of the macro reserve the copyrights of the original macro. However, you are welcome to distribute, modify and use the program under the terms of the GNU General Public License as stated here: (http://www.gnu.org/licenses/gpl.txt) as long as you attribute proper acknowledgement to the authors as mentioned above.
Please cite the following paper if publishing results: Dagda, R.K., Cherra III, S. J, Kulich, S.M. , Tandon, A , Chu, Park, D., Chu, C.T. Loss of PINK1 function promotes autophagy through effects on fission in neurons. J.Biol Chem. 284(20):13843-55, 2009.
Changelog
Multi macro functionality added to version 1.44 and 1.46
Macro allows has been re-looped to allow you to analyze more than one cell per field without exiting the macro - 04/09/2013
One bug was fixed in which the results are cleared prior to measuring another cell within the same field, otherwise previous area and perimeter calculations were included in the new measurements. - 06/01/2009
A feature was added which allows the user to close all windows without exiting the macro. Pressing the key [F4] will allow you to do that - 06/01/2009
Please refer also to the “Mitophagy” Macro which has the same functions.
Known Bugs
This macro only works on the old version of Image J, earlier versions than that of Image J 1.42
If you do not have the correct version of Image J, you can download and install the appropriate version of Image J on your computer (LINUX, Windows, OSX/Mac systems) here:
For any questions, please email at rdagda@medicine.nevada.edu
Validation and additional modifications of Macro
January 23, 2019
The current macro has been employed by many users worldwide since 2013. One particular study (Wiemerslage et al., 2016, Journal of Neuroscience Methods, 262: 56–65. doi:10.1016/j.jneumeth.2016.01.008) further validated the Mitochondrial Morphology macro in dopamine neurons and analyzed the relationship and interdependency of individual parameters quantified by the macro (number of mitochondria, area, elongation, interconnectivity) under various conditions using principle component analysis. The modified macro also allows to analyze mitochondria in specific cell types by using the “Colocalization” function to analyze colocalized mitochondria and precludes the need to manually trace cells or regions of interest. This modified version of the macro is available for download here. mito_morphology_macro_select_cell_polulations.txt

