−Table of Contents
NucleusJ
This plugin is dedicated to researchers interested in nuclear shape and chromatin organization. Starting from image stacks, the nuclear boundary as well as nuclear bodies are segmented. As output, NucleusJ automatically measures 15 parameters quantifying shape and size of nuclei as well as intra-nuclear objects and the positioning of the objects within the nuclear volume.
The plugin contains several methods to process and analyze 8 grey level image stacks of nuclei. For each method two versions are available, one version to analyze one image at a time and another for processing in batch mode.
NucleusJ paper : Poulet A, Arganda-Carreras I, Legland D, Probst AV, Andrey P, Tatout C. NucleusJ: an ImageJ plugin for quantifying 3D images of interphase nuclei. Bioinformatics. 2015 Apr 1;31(7):1144-6. doi: 10.1093/bioinformatics/btu774. Epub 2014 Nov 20. PubMed PMID: 25416749.
Authors
Axel Poulet
- UMR CNRS 6293, INSERM U1103, Genetic, Reproduction and Development, Clermont-Ferrand, France.
- Department of Biological and Medical Sciences Faculty of Health and Life Sciences, Oxford Brookes University, Headington Campus, Oxford, United Kingdom
Philippe Andrey
- Modeling and Digital Imaging Group, Institut Jean-Pierre Bourgin, INRA Versailles, France.
Contact: pouletaxel@gmail.com
Usage
This plugin aims to characterize the nucleus by nuclear morphology and chromatin organization parameters. It is divided into three main steps:
A. First step: Nucleus Segmentation
The well known Otsu method has been combined with the optimization of a shape parameter called sphericity (36 π × Volume^2 / Surface Area^3). The threshold value provided by the standard Otsu method is used as a starting point to test a range of thresholds, which eventually leads to the selection of the value for which the sphericity is maximal. The selected threshold is subsequently used to segment the nucleus.
The user first needs to enter the minimal and maximal volume of the object to be segmented. If no object is found the program creates a log file (named: logErrorSeg.txt) when the program runs in batch mode. If the program runs in single opened image mode, a graphical window displaying this information appears. Two alternatives are possible: run the segmentation process only (A.1) or run the segmentation process and an analysis of the results (A.2).
A.1 Nucleus Segmentation
This method only performs the segmentation.
- Nucleus Segmentation: The process uses as input an opened image and the image result is displayed on the screen.
- Nucleus Segmentation (batch): before running the plugin, a WorkDirectory dedicated to a given analysis should be created by the user. Raw images have then to be saved in a new sub-directory created by the user and named hereafter RawDataNucleus. The result of the segmentation process is saved automatically in a new sub-directory created by the plugin and called SegmentedDataNucleus.
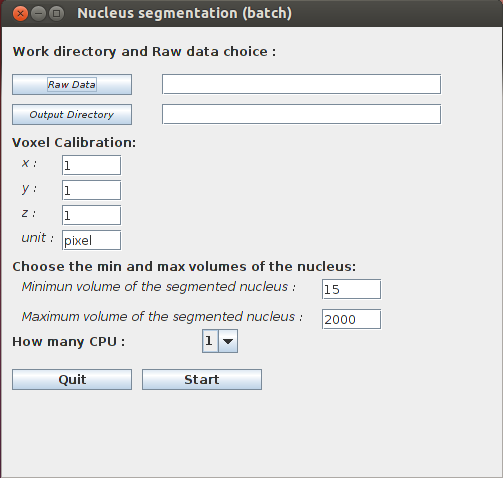
When the user is using one of these two methods, a pop up window appears:
The user has to inform the following parameters:
Work directory and raw data choice:
All the following steps are performed within the WorkDirectory
- Raw Data: choose the WorkDirectory which contains the raw images saved in a single sub-directory. In this documentation this sub-directory is called RawDataNucleus.
- Output Directory: choose the WorkDirectory the results are to be stored. This directory must contain the RawDataNucleus sub-directory containing the raw images.
Voxel Calibration corresponds to the voxel calibration used during the image acquisition..
- x: width of voxel: default value = 1.
- y: height of voxel: default value = 1.
- z: depth of voxel: default value = 1.
- unit: length unit (µm, …): default value = pixel.
Choose the minimum and maximum volume of the nucleus: only objects with a volume between the minimum and the maximum allowed volume will be segmented.
- minimum volume of the segmented nucleus: default value = 15.
- maximum volume of the segmented nucleus: default value = 2000.
How many CPU: number of CPU (Central Processing Unit) used for image segmentation.
Once the START button is pressed, the program will create a new sub-directory called SegmentedDataNucleus which contains the image of the segmented nuclei.
A.2 Nucleus Segmentation & Analysis (2D and/or 3D)
This part of the plugin first performs the segmentation and then the analysis of the segmented nucleus. Several nuclear morphology parameters listed below are computed.
Details of the 2D and 3D parameters generated by the plugin
The 2D nuclear morphology parameters are :
- AspectRatio = Major Axis / Minor Axis (source: ImageJ documentation). This is the 2D equivalent of the elongation parameter above.
- Circularity = (4π × Area / Perimeter2), ranges from 0 (infinitely elongated polygon) to 1 (perfect circle) (source: ImageJ documentation). This is the 2D equivalent of the sphericity parameter above.
These 2D parameters are computed on the slice where the nucleus reaches its largest area.
The 3D nuclear morphology parameters are:
- Volume: number of voxels in the nucleus x physical voxel size.
- Surface Area : sum of the areas of the voxel faces at the nuclear boundary.
- Equivalent spherical radius: radius of a sphere which has the same volume as the nucleus.
- Sphericity = (36π × Volume2 / Surface Area3). This parameter takes its maximum value 1.0 for a sphere and decreases towards 0.0 as the shape surface becomes less regular.
- Flatness = length of intermediate axis/length of shortest axis.
- Elongation = length of longest axis/length of intermediate axis.
Single image or batch analysis modes
- Nucleus Segmentation & Analysis: The process uses as input an opened image. The image results are displayed on the screen and results of the analysis are shown in the ImageJ log window.
- Nucleus Segmentation & Analysis (batch): before running the plugin, a WorkDirectory dedicated to a given analysis should be created. Raw images have then to be saved in a new sub-directory created by the user and named hereafter RawDataNucleus. The image results of the segmented nuclei are automatically saved in the SegmentedDataNucleus sub-directory in the main WorkDirectory. The results of the analysis are saved in two tabulated files named 3DNucleiParameters.tab and 2DNucleiParameters.tab.
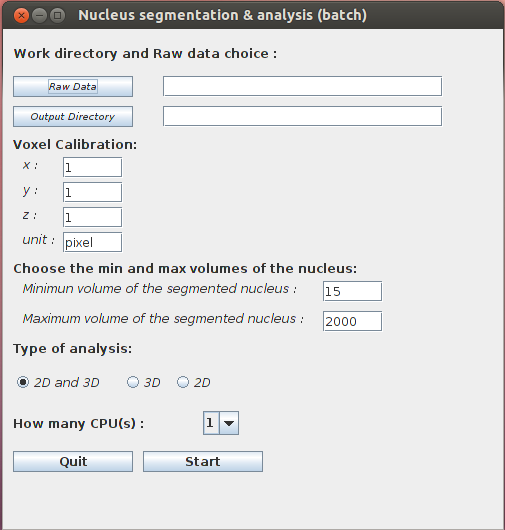
When the user is using one of these two methods, a pop up window appears:
The parameters are the same than for Nucleus Segmentation.
2D or/and 3D analysis:
- 2D and 3D: Two output files are created in the work directory 2DNucleiParameters.tab and 3DNucleiParameters.tab.
- 3D: 3DNucleiParameters.tab is created in the work directory.
- 2D: 2DNucleiParameters.tab is created in the work directory.
When you START, the program creates the sub-directory SegmentedDataNucleus which contains the image of the segmentation. This sub-directory, results file and log file are created in the main WorkDirectory (see also the example section of this documentation).
B.Second step: Chromocenter Segmentation
This step is based on the watershed algorithm (source: Beucher and Lantuéjoul, 1979; Vincent et Soille, 1991; Beucher et Meyer, 1993) adapted in 3D (ijpb plugins). First the algorithm automatically computes the intensity contrast of the regions detected by the 3D watershed (see Andrey et al, 2010). Second chromocenters are then be extracted by manual thresholding. Thus chromocenter segmentation requires two steps which are described below.
Automatic Step
- Chromocenter Segmentation: The process takes as input the opened image and the image results are displayed on the screen.
- Chromocenter Segmentation (batch): before running the plugin, a WorkDirectory dedicated to a given analysis should be created. Raw images have then to be saved in a new sub-directory created by the user and named hereafter RawDataNucleus. The result is saved in the ConstrastDataNucleus sub-directory in the WorkDirectory, with the same name as the raw images.
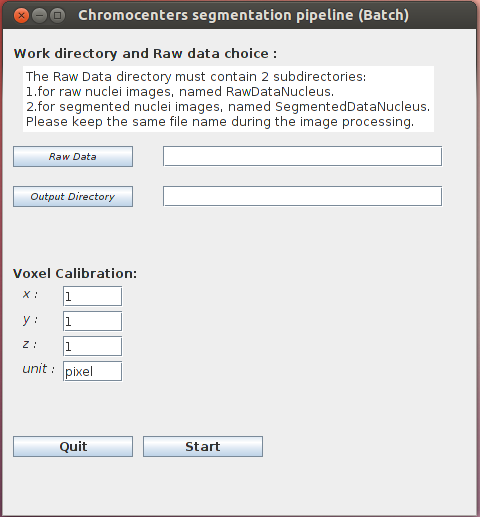
When the user is using one of these two methods, a pop up window appears:
Work directory and raw data choice
- Raw Data: The WorkDirectory should contain 2 sub-directories:
- RawDataNucleus: containing the raw images of the nuclei.
- SegmentedDataNucleus: containing the segmented images of the nuclei.
- Output Directory: choose the WorkDirectory the results are to be stored. This directory must contain the RawDataNucleus and SegmentedDataNucleus sub-directories. Hereafter, this new sub-directory is called ConstrastDataNucleus.
Voxel Calibration which corresponds to the voxel calibration used during the image acquistion:
- x: width of voxel: default value = 1.
- y: height of voxel: default value = 1.
- z: depth of voxel: default value = 1.
- unit: unit of this calibration (µm, voxel…): default value = pixel.
When press START, the program creates the sub-directory ConstrastDataNucleus which contains the image of contrast regions. This sub-directory is created in the WorkDirectory.
Manual Step
First you have to create the SegmentedDataCc sub-directory in WorkDirectory.
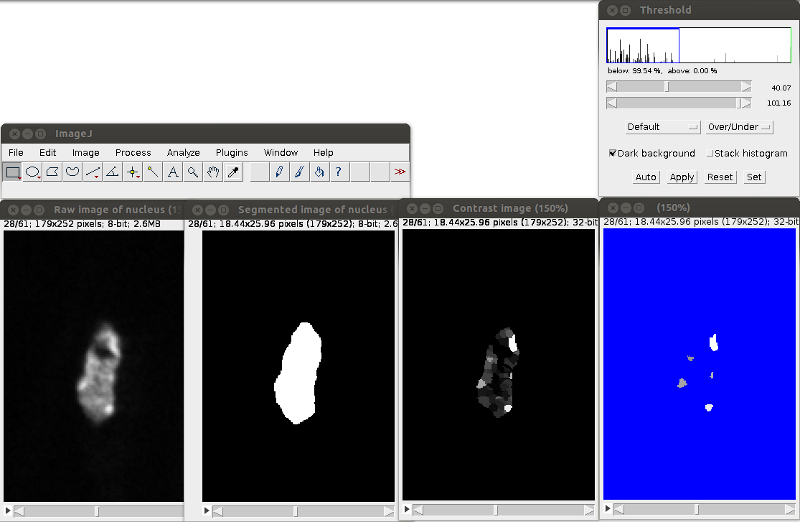
Then to realize the segmented image of chromocenters, you can open three images on ImageJ:
- the raw image of nucleus.
- the segmented image of nucleus.
- the contrast image of the nucleus.
You can synchronize images with the ImageJ tool Synchronize Windows (Analyze>Tools>Synchronize Windows)
To define chromocenters, use the threshold tool (ImageJ menu: Image>Adjust>Threshold). Check the box Dark background and Stack histogram and chose the Over/Under option in the second drop-down list. Once you have chosen your threshold value push the button Apply.
Save the segmented chromocenters (Ctrl+S or ImageJ menu: File>Save or File>Save as) with the same name as the raw image of the nucleus in the directory SegmentedDataCc.
C.Last step: Chromocenter Analysis
This step allows computing of nuclear morphology and chromatin organization parameters (see Usage). The plugin can generate 2 output files, one for the nuclear characterization (NucAndCcParameters.tab) and one for chromocenter organization CcParameters.tab). *Chromocenter Analysis: The process uses as an input 3 opened images:
- the raw image of the nucleus.
- the segmented image of the nucleus.
- the segmented image of the chromocenter(s).
The results of the analysis are displayed in the ImageJ log window.
- Chromocenters Analysis Pipeline (batch): the file(s) result(s) is (are) saved in the work directory.
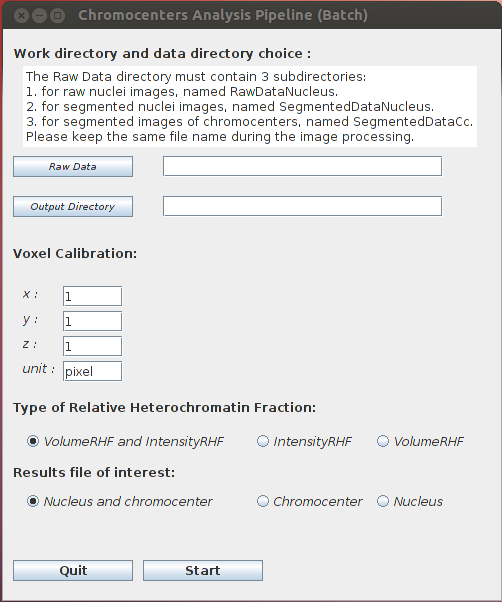
Work directory and raw data choice
- Raw Data: The main WorkDirectory must contain 3 sub-directories (a given image keeps the same name in all 3 sub-directories):
- RawDataNucleus containing the raw images of the nuclei
- SegmentedDataNucleus containing the segmented images of the nuclei
- SegmentedDataCc containing the segmented images of the chromocenters
- Output Directory: choose the WorkDirectory the results are to be stored.
Voxel Calibration which corresponds to the voxel calibration used during the image acquisition:
- x: width of voxel: default value 1.
- y: height of voxel: default value 1.
- z: depth of voxel: default value 1.
- unit: unit of this calibration (µm, voxel…): default value pixel.
Type of Relative Heterochromatin Fraction RHF (Fransz et al., 2002). This parameter determines the ratio of heterochromatin within the nucleus. This ratio can be computed with the volume (total chromocenter volume / nuclear volume) or the intensity (total chromocenter intensity / nuclear intensity).
- VolumeRHF and IntensityRHF: computation of the 2 RHF parameters.
- IntensityRHF: computation of RHF by the intensity.
- VolumeRHF: computation of RHF by the volume.
Result files of interest
- Nucleus and chromocenter: Two output files are created in the WorkDirectory NucAndCcParameters.tab and CcParameters.tab.
- Chromocenter: CcParameters.tab is created in the WorkDirectory.
- Nucleus: NucAndCcParameters is created in the WorkDirectory.
Once the START button is pressed, the program will created the results file(s) in the WorkDirectory.
The nuclear characterization parameters contained in NucAndCcParameters.tab are:
- The 3D parameters listed in A.2 Nucleus Segmentation & Analysis..
- The 2D parameters listed in A.2 Nucleus Segmentation & Analysis..
- NbCc: number of chromocenters in the nucleus.
- VCcMean: mean volume of chromocenter(s) per nucleus.
- VCcTotal: total volume of chromocenter(s) per nucleus.
- DistanceBorderToBorderMean: mean distance of chromocenter(s) border to nuclear periphery.
- DistanceBarycenterToBorderMean: mean distance of chromocenter(s) barycenter to nuclear periphery.
- IntensityRHF = total chromocenter intensity / nuclear intensity.
- VolumeRHF = total chromocenter volume / nuclear volume.
The chromatin organization parameters in CcParameters.tab are:
- Volume: volume of chromocenter.
- DistanceBorderToBorder: distance between chromocenter border to nuclear periphery.
- DistanceBarycenterToBorder: distance between chromocenter barycenter to nuclear periphery.
Example
Example of image processing with NucleusJ
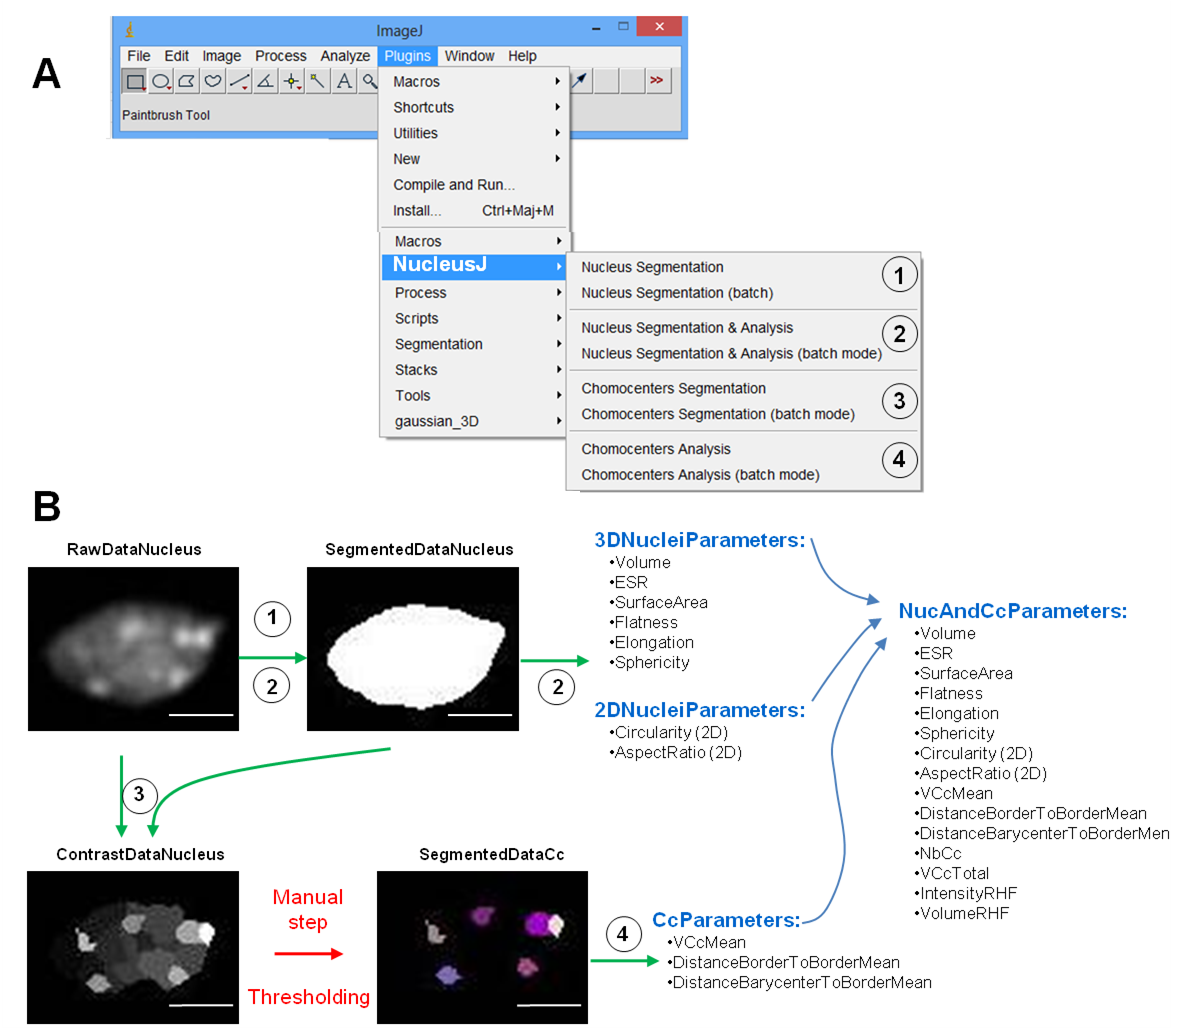
The first step is the nuclear segmentation
At this step you can chose two plugins to detect the nucleus :
- 1. Nucleus Segmentation or Nucleus Segmetation (batch) : You obtain the image result of the segmentation.
- 2. Nucleus Segmentation & Analysis or Nucleus Segmentation & Analysis (batch). If you run the Nucleus Segmentation & Analysis (batch) plugin you can have one or two result files, according to the option chosen, 2DNucleiParameters.tab and 3DNucleiParameters.tab. With this plugin you can have a log error file, which contains the name of the unsegmented images.
The second step is the detection of the chromocenter
- 3. Plugin “Chromocenter Segmentation” generates an image representing the contrast of the analyzed regions. The results are stored in ContrastDataNucleus sub-directory. This image has to be manually threshold to obtain the image of the segmented chromocenters and saved in the SegmentedDatadCc sub-directory with the same name as the raw image. This step could have been automatized but from our experience, automatic thresholding do not yield appropriate results. We kept that step as manual and relies on the expertise of the biologist. An example is given below: ImageJ menu at the top left, threshold tool on the right, 4 images at different stages of the process at the bottom. Green arrows indicate automatic processes while red arrow highlight the manual thresholding needed before the final analysis.
The last step is the analysis of nucleus and chromocenter
- 4. plugin “Chromocenter Analysis” creates one or two result files, according to the option chosen, NucAndCcParameters.tab and CcParameters.tab. This plugin can return a log error file, which contains the name of the images with a bad name.
Example of organization directory for batch analysis (recommended organization)
When starting an analysis, first the user should create a main WorkDirectory as well as a RawDataNucleus sub-directory.
Raw data from RawDataNucleus are used by Nucleus Segmentation and Nucleus Segmentation to create a new sub-directory called SegmentedDataNucleus.
Chromocenter Segmentation uses the images contain within the RawDataNucleus and SegmentedDataNucleus to apply the 3D watershed transformation. Each new contrasted image are stored in a new sub-directory called ContrastDataNucleus.
Manual thresholding should be performed on the contrasted images contained within ContrastDataNucleus. Once the threshold is applied, the image should be stored in a new sub-directory created by the user and called SegmentedDatadCc.
Finally Chromocenter Analysis is applied on the segmented chromocenters.
The complete plugin leads to 4 sub-directories and 4 logout files. 2 logError files may also been produced. To help the user, an example is given below where:
- directories and sub-directories created by the user are in red
- sub-directories automatically created by NucleusJ are in blue.
- All the files in the work directory are created by NucleusJ .
Installation
Download NucleusJ https://github.com/PouletAxel/NucleusJ_/releases/tag/v1.0.3 in your ImageJ plugins folder and then restart ImageJ or simply apply the command Help>Refresh Menus.
Dependencies
- MorphoLibJ_.jar: https://github.com/PouletAxel/NucleusJ_/releases/tag/v1.0.3
- imagescience.jar : https://github.com/PouletAxel/NucleusJ_/releases/tag/v1.0.3
Download
Citation
Andrey, P., Kiêu, K., Kress, C., Lehmann, G., Tirichine, L., Liu, Z., Biot, E., Adenot, P.-G., Hue-Beauvais, C., Houba-Hérin, N., Duranthon, V., Devinoy, E., Beaujean, N., Gaudin, V., Maurin, Y.,Debey, P., 2010. Statistical Analysis of 3D Images Detects Regular Spatial Distributions of Centromeres and Chromocenters in Animal and Plant Nuclei. PLoS Comput Biol 6, e1000853.
Beucher, S., Lantuéjoul, C., 1979. Use of watersheds in contour detection. International workshop on image processing, real-time edge and motion detection.
Beucher, S., Meyer, F., 1993. The morphological approach to segmentation: the watershed transformation. Mathematical Morphology in Image Processing.
Fransz, P., de Jong, J.H., Lysak, M., Castiglione, M.R., Schubert, I., 2002. Interphase chromosomes in Arabidopsis are organized as well defined chromocenters from which euchromatin loops emanate. Proceedings of the National Academy of Sciences 99, 14584 –14589.
Otsu, N., 1979. A threshold selection method from gray-level histograms. IEEE Trans. Sys., Man., Cyber. 9, 62–66.
Vincent, L., Soille, P., 1991. Watersheds in digital spaces: an efficient algorithm based on immersion simulations. IEEE Transactions on Pattern Analysis and Machine Intelligence 13, 583–598.
Changelog
version nucleusJ.1.0.3
Index bounds error similar to the previous in the version 1.0.2
To use nucleusJ you need to dowload the two depencies available here plus jama.jar. New version of nucleusJ was realised to correct this error: correction of loop problems
Imagescience.jar version problem:
(Fiji Is Just) ImageJ 2.0.0-rc-61/1.51n; Java 1.8.0_66 [64-bit]; Windows 10 10.0; 46MB of 5991MB (<1%)
java.lang.NoClassDefFoundError: imagescience/utility/ImageScience
at gred.nucleus.myGradient.MyEdges.run(MyEdges.java:47)
at gred.nucleus.myGradient.MyGradient.run(MyGradient.java:74)
at gred.nucleus.core.ChromocentersEnhancement.applyEnhanceChromocenters(ChromocentersEnhancement.java:32)
at gred.nucleus.plugins.ChromocenterSegmentationBatchPlugin_.run(ChromocenterSegmentationBatchPlugin_.java:65)
at ij.IJ.runUserPlugIn(IJ.java:217)
at ij.IJ.runPlugIn(IJ.java:181)
at ij.Executer.runCommand(Executer.java:137)
at ij.Executer.run(Executer.java:66)
at java.lang.Thread.run(Thread.java:745)
Morphlib error:
Creation of image of the CC without no image, that is due at nucleusJ which is working with the version of MorpholibJ_-1.2.2 or anterior.
version nucleusJ.1.0.2
New version of nucleusJ was realised to correct this error:
java.lang.IndexOutOfBoundsException
at ij.ImageStack.getVoxel(ImageStack.java:373)
at gred.nucleus.core.NucleusSegmentation.isVoxelThresholded(NucleusSegmentation.java:218)
at gred.nucleus.core.NucleusSegmentation.applySegmentation(NucleusSegmentation.java:118)
at gred.nucleus.core.NucleusSegmentation.run(NucleusSegmentation.java:53)
at gred.nucleus.plugins.NucleusSegmentationAndAnalysisPlugin_.run(NucleusSegmentationAndAnalysisPlugin_.java:63)
at ij.IJ.runUserPlugIn(IJ.java:217)
at ij.IJ.runPlugIn(IJ.java:181)
at ij.Executer.runCommand(Executer.java:137)
at ij.Executer.run(Executer.java:66)
at java.lang.Thread.run(Thread.java:745)


